Describe Image Task in PTE Academic, UKVI & Core
The "Describe Image" is the third task that appears in the exam’s Speaking section &
is one of the most challenging yet rewarding components of the PTE (Pearson Test of English) exam. This task not only assesses your speaking skills but
also tests your ability to observe, interpret, and analyze visual information
quickly & accurately. Mastering this section can significantly boost your overall
score.

What is the Describe Image Task in PTE?
In the Describe Image in PTE task, you will be presented with an image on your screen. Your objective is to describe the image in detail within the specified 40 seconds. You will have 25 seconds to study observe & gather your thoughts about the image and prepare your response before the recording begins. The task evaluates your ability to speak clearly and coherently while using appropriate vocabulary to describe what you see.
The challenge lies in organizing your thoughts quickly and delivering them effectively within the time limit. Your goal must be to provide a clear, concise, and coherent description of the image, focusing on the main features and relevant details.

Types of Images in the Describe Image PTE Task
The exam can present a variety of image types for you to describe. Each type of image requires a different approach, so it’s important to familiarize yourself with the formats:
1. Graphs or Charts:
Bar Graphs:
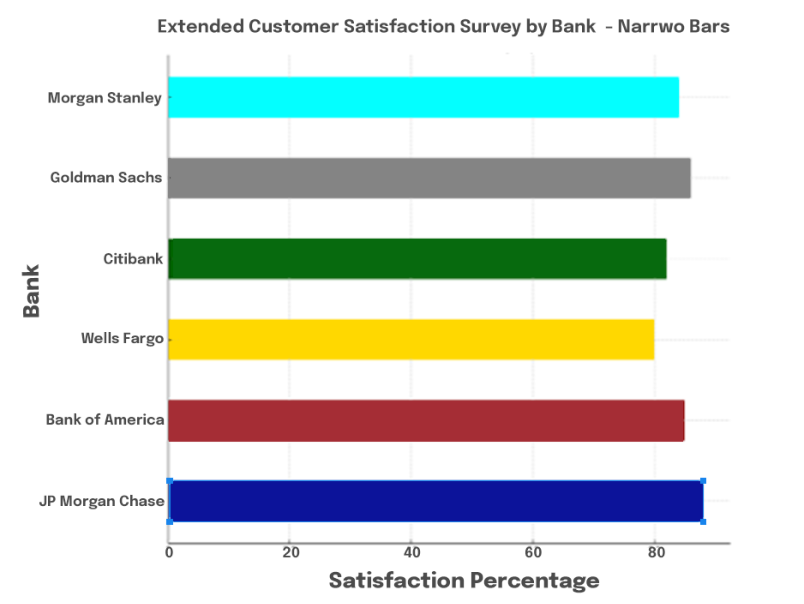
These display data using rectangular bars representing different categories. The bars can be horizontal or vertical, and your job is to describe the comparisons, and key data points.
Line Graphs:
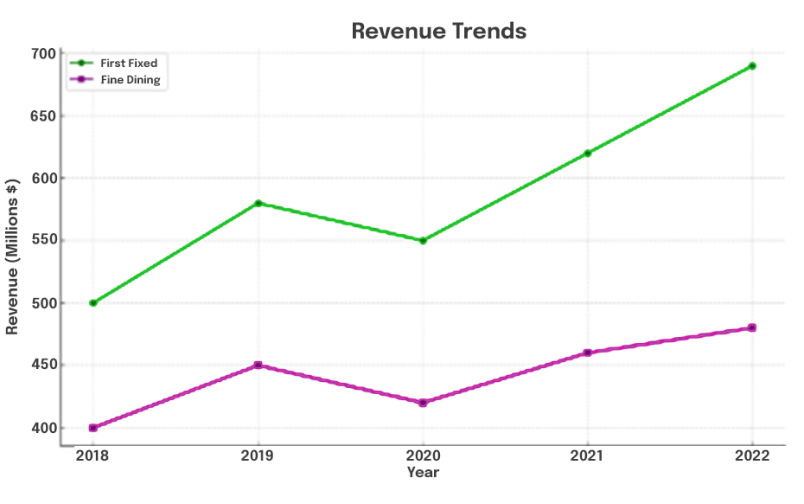
Line graphs show trends over time, with lines connecting data points. When describing a line graph, focus on the overall trends, peaks, and troughs, and any noticeable changes or patterns.
2. Maps:
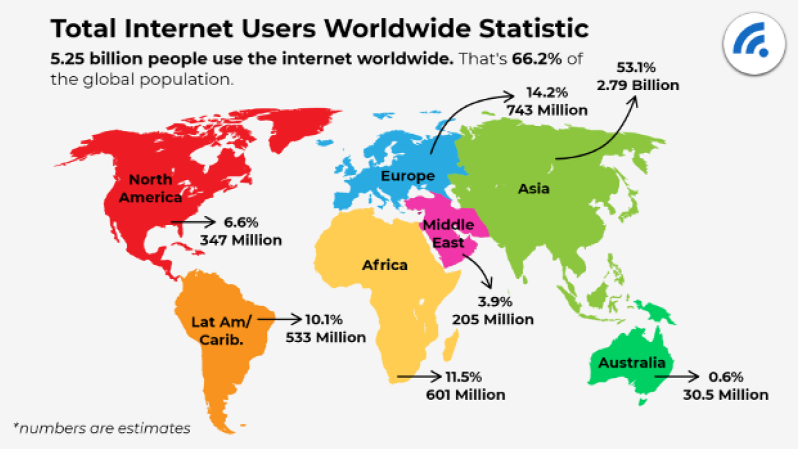
Maps often show geographical locations, routes, or distributions. When describing a describing a map, highlight key landmarks, directions, and any notable patterns or differences.
3. Table:
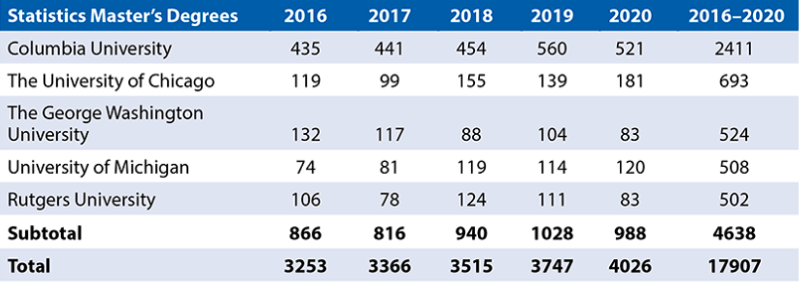
Tables present data in rows and columns & are often used to compare different sets sets sets of information. For tables, summarize the key information by highest and lowest values, trends across the table, and any significant figures.
4. Process Diagrams or Flowcharts:
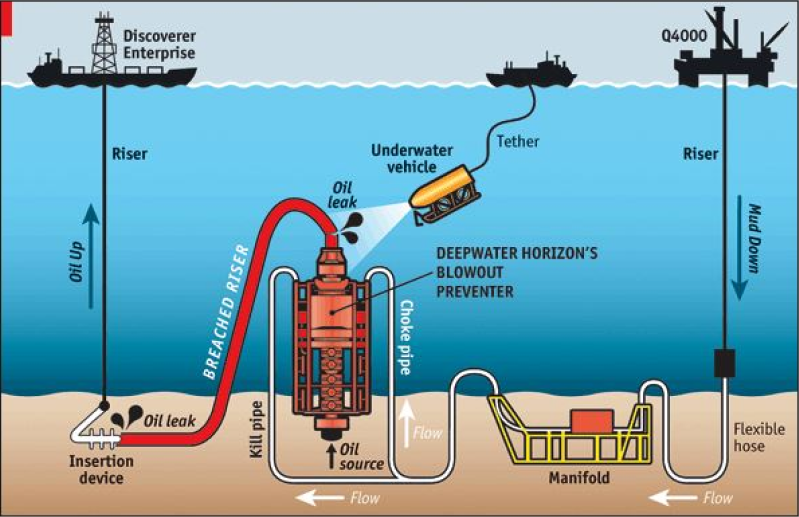
These diagrams illustrate a process or sequence of events. Your task is to describe the process step by step, ensuring you cover the sequence logically and clearly.
5. Piechart:
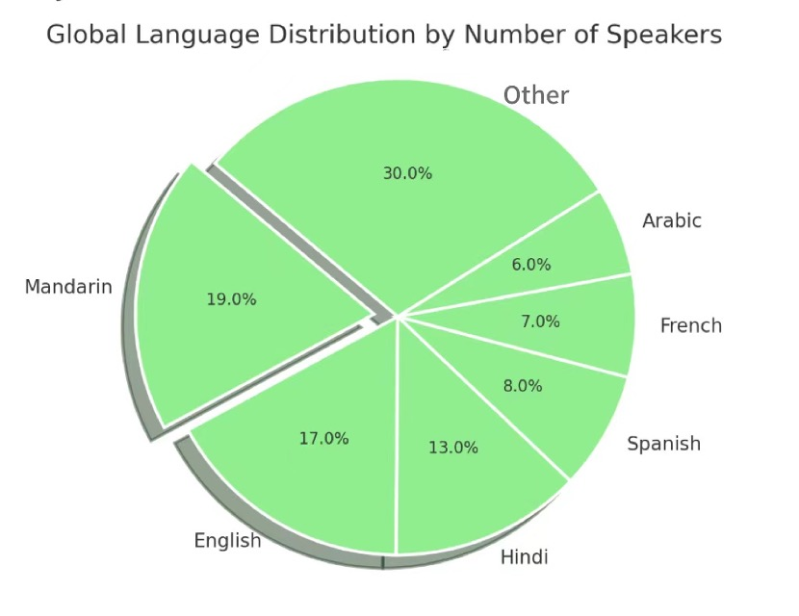
A pie chart is a circular chart divided into sectors, each representing a proportion of the whole. Your description should include the largest and smallest segments, comparisons between segments, and any notable insights.
6. Pictures or Diagrams:
You might encounter images like photographs, illustrations, or diagrams that depict a process, scene, or object. In this case, describe the key features, relevant details that capture the essence of the image.


Start Describe Image PTE Practice
PTE Describe Image Practice Questions
An image will be presented on the screen for which you will have 25 seconds to prepare, and you can check the image carefully to provide an answer related to that. You need to speak for 40 seconds for this image in the microphone and provide details about it, in as much detail as you can observe.
Do not forget to take care of your proper pronunciation, fluency, and information related to the image, and speak with clarity.
Try to cover all the important aspects of the image, and your answer will be properly structured.
Once recording begins, you can see the countdown timer that shows how much time is left for your microphone to get turned on. Once the timer ends, a short beep can be heard. You must begin talking after the beep. Avoid speaking before the microphone gets turned on, as the device will not record your audio.
- You should not hurry while you are speaking.
- Once you have finished speaking, please submit your answer.
- If you do not stop even after the timer ends, the answer will be submitted automatically. Stop recording once the timer stops. Status “Recording” will now change to “Completed.”
- Answers can be recorded only once.
Provided below are a few sample questions for you to understand & prepare:
Sample Question 1:
Sample Question 2:
Sample Question 3:
Sample Question 4:
Sample Question 5:
Sample Question 6:
Sample Question 7:
Sample Question 8:
Sample Question 9:
Sample Question 10:
Access Describe Image PTE Practice

Tips for acing the PTE Describe Image Practice task:
Understand the Image Quickly:
Use your 25 seconds of preparation wisely. Identify the key elements and structure your response in your mind.
Focus on Key Details:
Avoid trying to describe every detail. Focus on the most important aspects that convey the overall message of the image.
Use Appropriate Vocabulary:
Use descriptive and comparative language to highlight trends, differences, and key points.
Practice Time Management:
40 seconds is all you have to speak. Practice delivering concise and well-structured descriptions within this time frame.
Be Fluent:
Fluency is crucial in the Describe Image task. Aim to speak smoothly without unnecessary pauses or hesitations. This will help you deliver a clear and coherent description, making a strong impression on the examiner.
How to Effectively Describe an Image in PTE Using a Template
A structured approach can ensure clarity and precision when effectively describing an image in the PTE Speaking section. First, introduce the image by saying, “There is an interesting picture in front of me.” Then, move on to the key elements, observing details such as objects, people, or settings with phrases like, “By having a closer look, I can see a number of things in the image.” Start with the title:
“The title is…” or mention that there’s no title provided. Identify interesting aspects, including words, shapes, and significant numbers like, “The image includes significant numbers/years/shapes such as…”. You can also point out any prominent colors: “There are beautiful colors like… and… is my favorite.”
For graphical images, it’s important to highlight both the extremes: “The graph gives information about the highest value like… and the lowest value which is…”. Summarize and conclude within 40 seconds, saying, “I cannot go into further details as my time is over, so I will click next. Thank you.”
This describe image pte template ensures that your description is organized and covers all major elements efficiently, helping you score well in the PTE Speaking section.
By familiarizing yourself with these types of images and practicing regularly, you can
gain confidence in tackling the Describe Image task effectively, ultimately boosting
your PTE Academic, UKVI or Core score.
Use full video for PTE Describe Image
Learn more about other questions
Your Guide to Every Section of the PTE Exam

Speaking

Reading
Get Help with Describe Image PTE
FAQs
Here are answers to some of the frequently asked questions.
What is the Describe Image task in PTE Academic / UKVI and PTE Core?
The Describe Image is the 3rd task in the Speaking part which requires test-takers to speak for 40 seconds about a given image. This image could be a graph, chart, diagram, map, or picture.
How many Describe Image tasks are in the PTE exam?
Typically, a test taker will encounter 5-6 Describe Image questions in the Speaking section of PTE Academic, UKVI, and Core.
What types of images can be expected in the PTE Describe Image task?
The images can include bar charts, pie charts, line graphs, maps, process diagrams, flowcharts, and pictures of objects, landscapes, or people.
How much time will be given to prepare before speaking in the Describe Image PTE task?
There will be a preparation time of 25 seconds to study the image before the recorder opens to record the test taker’s response.
Is it okay to use a template when describing the image in the PTE Exam?
Yes, using a template can help structure responses and ensure all necessary points are covered. However, it’s important to ensure the template is flexible and can be adapted to different types of images.
Can we pause or restart during the Describe Image task in PTE?
No, you cannot pause or restart the recording. Once the microphone opens, you need to speak continuously for the entire 40 seconds.
Does the Describe Image task affect my overall PTE score?
Yes, this task contributes to the Speaking score and therefore impacts the overall PTE score.


